
A statistic can be accurate and still create the wrong impression. Ten turnovers may indicate careless play, or simply reflect a fast game with far more possessions than usual. A high shot count may show territorial pressure, yet say little about the quality of those attempts. Reading sports data well starts by asking what opportunity produced the number, what conditions shaped it, and whether the same measure means the same thing in another sport. Raw totals describe events. Context determines what those events can reasonably tell us.
A PLOS One comparison of 6 invasion sports illustrates why the denominator matters. The researchers compared basketball, handball, water polo, field hockey, football, and ice hockey by estimating possessions, then calculating measures, such as shots per possession and points per shot. Normalising by possession reduced the influence of game pace, which differs substantially across sports and can also change within the same sport. The study did not make every game directly equivalent. It created a fairer basis for asking how often teams produced and converted opportunities.
Start With the Opportunity Behind the Number
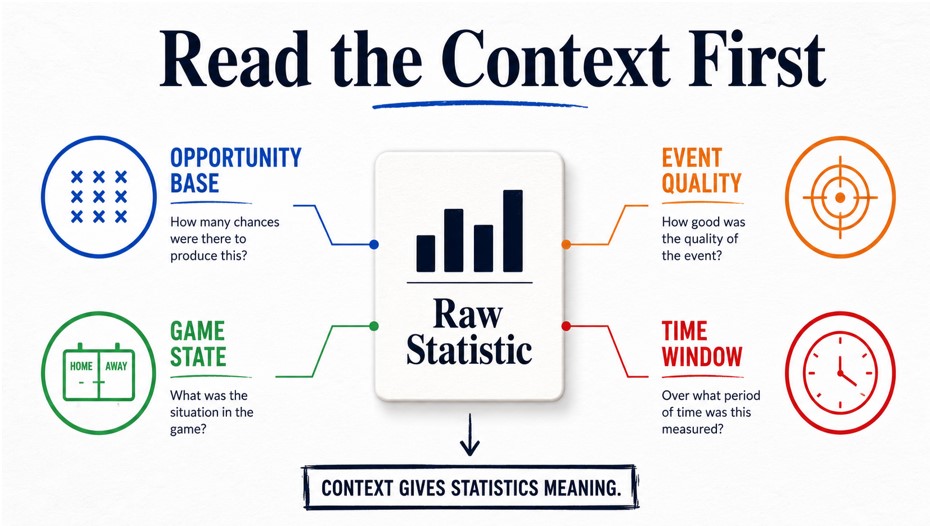
The first question is not whether a statistic is high or low. It is how many chances existed for that statistic to occur. Turnovers should be read against possessions, serving errors against service attempts, and scoring chances against the amount of time or territory a team controlled. Without that base, a busier match can make both strong and weak performances look more extreme.
For a viewer following a match while using Lucky Rebel, the same discipline keeps a live number in proportion. A basketball team with 8 turnovers may be protecting the ball well in a high-possession game, while 8 in a slower contest could represent a much larger share of its opportunities. In tennis, first-serve percentage already includes an attempt-based denominator, but it still needs the score, surface, and opponent to explain its significance. Football offers another problem: 12 shots can come from repeated low-quality efforts or a smaller number of dangerous situations followed by blocked attempts.
Opening Lucky Rebel alongside the broadcast does not change the analytical task. Useful interpretation still comes from separating an event count from the opportunities that produced it, then checking the quality and circumstances of those opportunities. That habit prevents a number from appearing informative merely because it changed quickly, looks large on the screen, or confirms what the viewer already expected.
A cross-sport discussion of real-time match statistics shows how easily different kinds of evidence can be grouped together. It refers to turnover rate and points per possession in basketball, first-serve percentage and unforced errors in tennis, and possession, shots, and expected goals in football. These measures are not interchangeable. Some are rates, some are event totals, and others estimate the quality of opportunities. The useful lesson is to identify what each number actually measures before drawing a common conclusion from them.
Apply Four Context Checks
Four questions make most sports statistics easier to interpret.
What is the denominator? A raw total needs an opportunity base. Per-possession, per-attempt, and per-minute rates can reveal whether volume came from efficiency or simply from more chances.
What is the quality of the event? Two shots are not automatically equal. Location, defensive pressure, and the sequence that created the attempt can matter more than the count alone.
What was the game state? Teams change behaviour when leading, trailing, protecting players, or adjusting to an opponent. Possession gained while chasing a match may mean something different from possession used to protect a lead.
What is the time window? A 5-minute burst may be important without representing the full match. Short windows capture immediate changes, while longer ones show whether the pattern persisted.
These checks also stop cross-sport comparisons from becoming superficial. Basketball naturally creates more scoring attempts than football. Tennis divides play into points, games, and sets rather than possessions. Ice hockey allows rapid changes in control and personnel. A useful comparison therefore preserves each sport’s structure instead of judging every performance through the same raw totals.
More Data Does Not Remove the Judgement
A 2026 Frontiers paper on the gap between sports analytics and coaching practice argues that greater data availability does not automatically improve decisions. Measures such as possession or passing accuracy can change meaning with match status, opposition quality, playing style and tactical intention. The paper’s broader point is practical: a metric becomes useful when it is connected to the decision, context and action it is meant to support.
That principle applies to spectators as much as analysts. A statistic should answer a defined question. Is the reader measuring workload, control, chance creation, execution, or a temporary shift in play? If the question is unclear, more numbers can produce a more detailed version of the same confusion.
The strongest interpretation is often narrower than the headline claim. A team created more shots, but were they better shots? A player’s error rate increased, but against stronger pressure or during a longer match? A number becomes meaningful when its opportunity base, quality, game state, and time window point in the same direction. Until then, it is a description of what was counted, not a complete explanation of what happened.