
The copper-gold ratio may hold the key to understanding the cycles of the current bear market, and when it might possibly end, analysts at Stifel GMP believe.
The post-inversion re-steepening of the yield curve has coincided with the shift into a risk-asset liquidation phase, according to Stifel, but the timing of that shift remains elusive.
“Despite record low consumer sentiment and declining business sentiment, nominal earnings have remained resilient, particularly for companies with inflation passthrough pricing power,” the Stifel analysts said in a recent note.
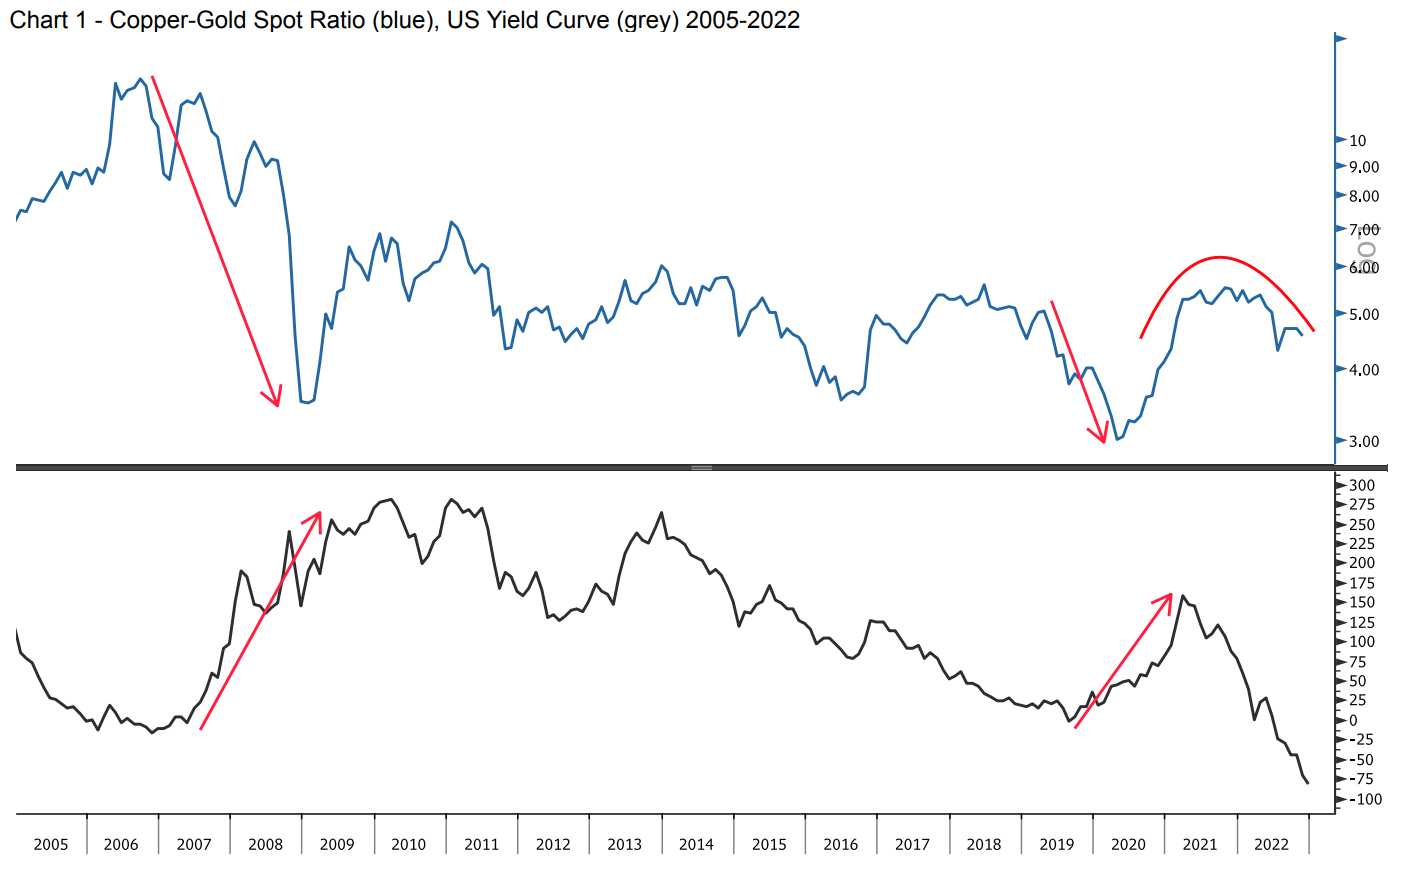
“History suggests that the copper/gold ratio may provide another signal as the monetary metal outperforms the cyclical metal into the earnings downturn and risk asset liquidation. While not yet definitive, the recent rollover in the copper-gold ratio bears close monitoring," they added.
(It’s worth noting that the Stifel analysts believe that we are in the midst of a stagflationary bear market, although others may not agree.)
What is the copper-gold ratio?
First, a quick primer: As most value investors know, the copper-gold ratio measures the relative strength of industrial activity against fears of economic recession or inflation. For example, economic expansion typically increases the ratio as industries invest and increase production because of confidence that household demand and consumption will grow.
On the other hand, declines in the copper-gold ratio are often linked to a downturn in the business cycle and slowing production, because inflation usually has a negative impact on industrial activity.
'Great Bear Market of 2022' phases
Stifel's analysts believe that Phase 1 of the 'Great Bear Market of 2022' was shaped by the removal of the emergency liquidity pumped into the economy during the pandemic. That liquidity “found its way into virtually every nook and cranny of speculative assets,” the analysts said in July 2022, and it caused a staggering $26 trillion dollars of global wealth to disappear in equities and crypto alone.
Inflation is making the problem worse. Unlike other bear markets, the global fixed income market has also seen more than $20 trillion of losses since its peak as central banks around the world have raised interest rates to fight inflation, the analysts noted. That number increases to $50 trillion when including the decline in real estate values around the world.
“This already surpasses the wealth destruction in the nearly two-year so-called global financial crisis, and we are only seven months in,” they added.
However, the analysts believe that Phase 2 of the bear market will be “more of a two-sided market with a tug of war” between cyclical decline in earnings estimates compared to anticipation of a central bank pivot because of easing inflation and commodity price pressures and the consumer slowdown.
But the “sheer weight” of the staggering losses in terms of wealth effect from the artificial liquidity-fuelled peak, combined with ultimately stubbornly high structural inflation, will leave central banks behind the asset reflation curve, they added.
“The weight of the avalanche will prove unstoppable and in keeping with our analysis that the magnitude of the decline will mirror the cumulative excesses of the prior asset inflation. As we have shown in our comparisons to prior bear markets, this is a polar bear,” the Stifel analysts said.
Understanding liquidation and capitulation
That brings us to Phase 3: liquidation and capitulation.
As the Stifel analysts pointed out, in prior cycles, gold outperformed copper either prior to or confirming a 're-steepening' of the yield curve, which signaled risk asset liquidations.
A re-steepening yield curve could lead to a sharp downturn in both equity markets and earnings, but timing is tricky given the inflation pass through, the analysts noted.
“Our call has been that nominal earnings may be stronger for longer than prior bear markets, which has proven prescient. Further, as the 1979-1982 period highlights, curve inversion can last longer when a central bank is singularly focused on inflation. which is one reason why the copper/gold ratio may prove to be a key indicator in determining risk asset behavior," they added.
The beginning of the end?
Right now, the copper/gold spot ratio leads the S&P 500 earnings per share (EPS) growth on an average by five months.
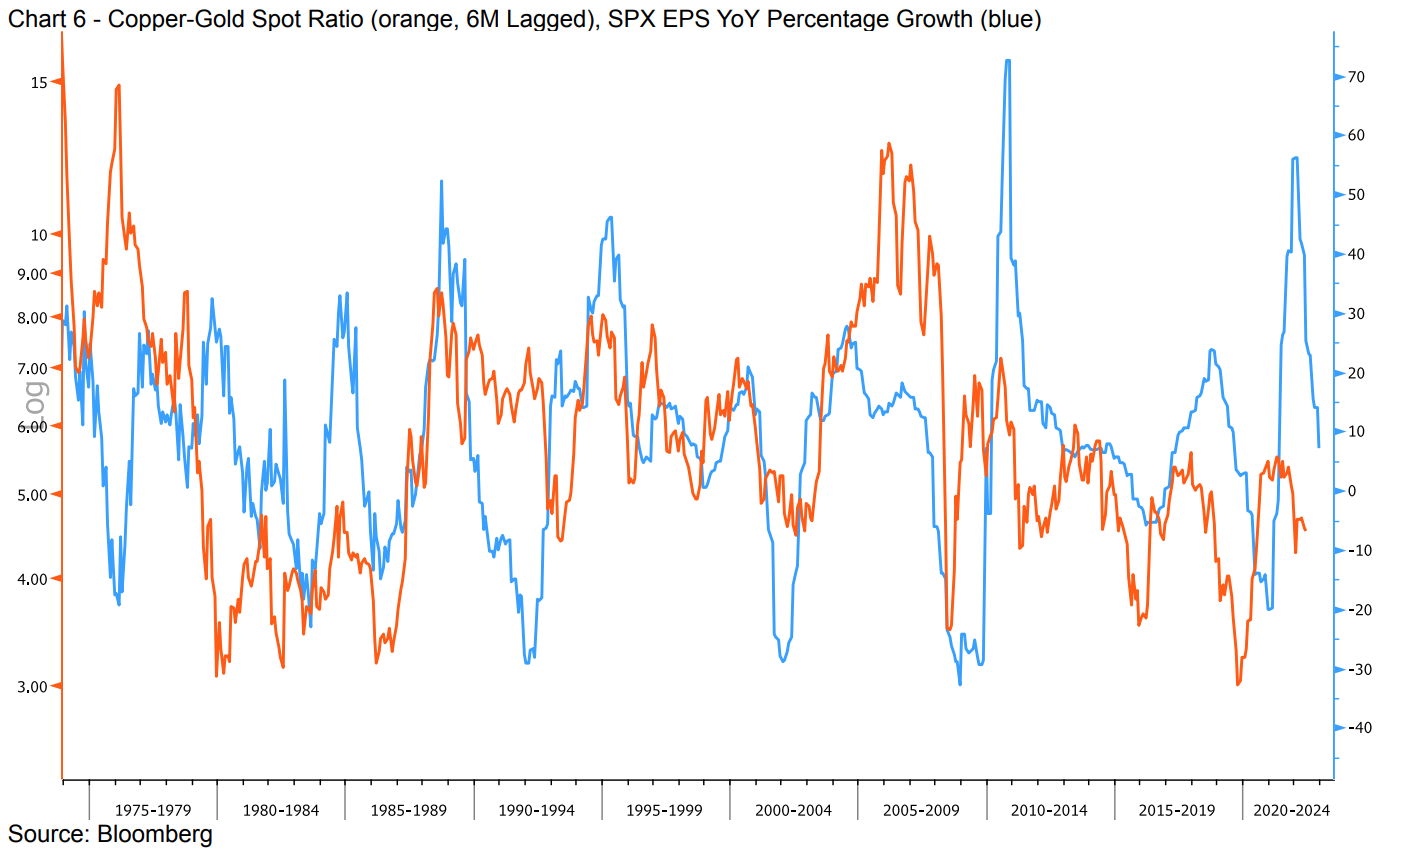
That indicates negative EPS growth in the first quarter of 2023, the Stifel analysts noted.
The analysts said that they will remain focused on the copper/gold ratio to understand when or if a final capitulation phase of the bear market will start.
The recent shift in the oil and copper futures curve from backwardation to contango may be forecasting that this shift will occur sooner rather than later, they concluded.
Contact Angela at angela@proactiveinvestors.com
Follow her on Twitter @AHarmantas